


Automation all the way - Machine Learning for IT Service Management
Carsten Mönning, Waldemar Schiller, Andreas Woditschka and Andreas Söderlund


Carsten Mönning, Waldemar Schiller, Andreas Woditschka and Andreas Söderlund
In a previous blog post, we gave some structure to the seemingly free-wheeling world of Machine Learning (ML) algorithms. Now, we will have a closer look at a proper, already well-established ML use case, IT service management (ITSM), including a prototypical ML implementation.
ITSM deals with the efficient resolution of IT issues and requests trying to keep business interruptions to a minimum. IT service teams are under constant pressure by the business organization to improve its services at increasing speed and decreasing costs. Accelerating technological advances in fields such as smart data and data science, cloud and mobile computing and IT consumerisation trends such as Bring-Your-Own-Device are additional, quickly developing challenges: Much more diverse and individualistic technological setups have to be provided and maintained with much greater agility.
Add to this the steadily increasing number of “intelligent things” that result in a proliferation of automatically, event management-triggered incidents and it should become clear that IT service organizations need to turn to recent technological advances themselves to stay on top of things. In fact, Gartner, the analyst firm, suggests to go on the offensive and to invest in Machine Learning, Big Data and other smart-machine technologies to make current and future IT service desk operations more proactive. Gartner predicts that by 2019, IT service desks utilizing machine learning-enhanced technology and Artificial Intelligence will not only manage to stay on top of things but also to free up to 30% of support capacity for higher-value tasks (Fletcher and Lord, 2016). During IT service ticket processing, substantial amounts of process-related data are produced making the idea of using these data for ITSM optimization using modern ML algorithms for ITSM automation a somewhat appealing proposition.
Key ITSM services such as incident and service request management are characterized by standardized processes starting with customer-driven ticket generation, followed by manual ticket categorization and prioritization, dispatching and resolution by specialised IT helpdesk and support teams (Figure 1).
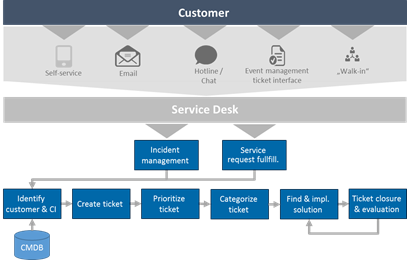
Categorization is of particular importance for the quality of this processing pipeline: Wrong manual ticket categorizations prevent ticket dispatching to the right support team and thus the timely start of the issue resolution process. This then typically results in iterative ticket re-assignment attempts and, ultimately, the violation of processing service level agreements putting business operations at risk.
The manual steps responsible for these process breakdowns are partially deterministic in nature. That is, IT staff are concerned with the mapping of mostly text-based ticket symptom descriptions to predetermined levels of priority and to given classes of support topic category, e.g., user and access management, network or workplace management.
In addition, the underlying ticket system generates and stores substantial amounts of prioritization and subject matter classification, i.e. training and testing, data. In other words, these ticket processing steps suggest themselves for ML-based automation with the goal of manual intervention and thus categorization error rate reduction and overall process efficiency improvement. A pretty straightfoward ML business case, by comparison.
Our case study of applying ML algorithms to real-world ticket data for automatic ticket categorization prototyping opens the door for the ultimate objective of automatic, ML-enabled processing pipelines operating 24/7 from ticket generation to ticket dispatching and support team assignment. Manual ticket categorization and dispatching effort is minimized, IT help desk resources can be assigned to higher-value tasks and the number of process breakdowns can be reduced. This way the objectives of future-proof, sustainable, low-cost, timely and high-quality ticket resolution for ITSM optimization can be met much more realistically. We aspire to motivate readers to take this relatively straightforward, business case-driven ML scenario and start considering their own ITMS automation scenarios.
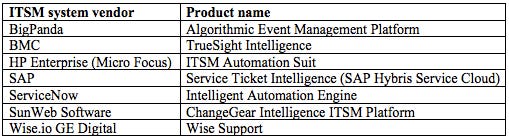
Due to the partially deterministic nature of the processes depicted in Figure 1, a number of ML-based process automation ideas have been put forward in the literature (Di Lucca, Di Penta and Gradara, 2002) (Diao, Jamjoom and Loewenstern, 2009) (Diao, Jan, Li, Rosu and Sailer, 2016) (Lin, Raghu, Ramamurthy, Yu, Radhakrishnan and Fernandez, 2014) (Roy, Muni, Yan, Budhiraja and Ceiler, 2016), and are increasingly getting picked up by ITSM product (Table 1) and consulting service providers.
The ML-based process automation ideas consist of, in particular:
Automatic ticket priorization
Automatic ticket categorization
Automatic ticket solution
The optimization alternatives 1 and 2 can be modeled in the form of supervised ML classification problems with two or more output categories. Alternative 3 can be regarded as an unsupervised ML clustering problem assigning a new ticket to a cluster of known solutions.
Our case study focuses on the prototyping of ML-based, automatic proposal of ticket categories, i.e. alternative 2. Alternative 1 is structurally identical but typically provides less immediate business value. Alternative 3 would qualify as the final step in a fully automated processing pipeline for certain types of issues or service requests.
The training and testing data sets for the scenario 2 implementation are retrieved from an international, multi-site ITSM production system. Around 300 IT service employees at 75 European locations operate on the platform, which processes around 20,000 monthly tickets of the various ticket types.
Use cases and training data
We use 6,500 and 12,000 historical incident and service request data sets, respectively, retrieved from the production system covering a six-month operations period in 2016 to train and to evaluate both a binary and a more general, multi-class ticket categorization use case:
Automatic categorization of incoming tickets as password request-related tickets.
Automatic categorization of incoming tickets into one of seven subject matter categories.
The use cases are implemented and evaluated using a third-party analytics platform. Pointers to their straightforward, platform-agnostic implementation are provided further below.
The basic structure of the two training and testing data sets is identical and consists of the following data fields:
integer ticket ID,
40-character symptom description in both German and English language and
subject matter category text field.
The subject matter category text field provides top-level ticket categorization information consisting of one of the following seven categories:
User and Device management (U&D)
Exchange and Communication (E&C)
Location, Network and Server (L&S)
Customer Applications (CA)
Projects, Consulting and Security Services (P&S)
Administration and Internal Services (A&I) and
Other/Clearing (O/C)
The use case 1 data set, Data2Class, consists of 6,500 data records and two (additional) labelled classes, password reset (PR), and other, with PR representing positive password reset request cases and other representing non-password request tickets.
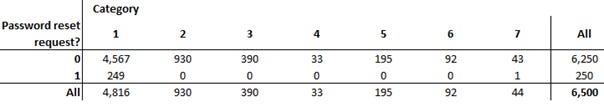
Not unexpectedly, the binary contingency table, Table 2, of the password reset indicator and the ticket category levels 1–7 reveals that a ML algorithm capable of “robustly” classifying an incoming ticket as password reset-related, or not, (binary classification problem) would be almost equivalent to solving the more challenging multi-classification problem of classifying an incoming ticket as belonging to one of the seven ticket categories. (The contingency table, descriptive statistics and histogram visualization were computed using the Pandas and Matplotlib libraries as part of the Anaconda Python distribution.) We are therefore restricting ourselves to dealing with the simpler, binary classification problem in the form of use case 1 to start off with.
The use case 2 data set, Data7Class, consists of 12,000 data records and seven (additional) labelled classes corresponding to the seven ticket categories listed above.
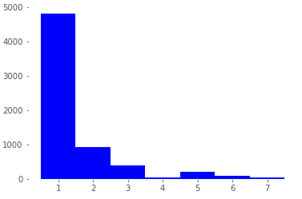
As is typically the case with real-life ITSM data, the distributions of both Data2Class and Data7Class, shown in Figure 2 and Table 3, respectively, are strongly skewed towards the first three of the seven ticket categories. (It needs to be kept in mind that, since the Accuracy, Precision and F1 evaluation metrics used for model scoring and selection purposes further below take into account values from all classes, their values are sensitive to skewed test data distributions.)

Machine learning processing pipeline
The ML processing pipeline for these two scenarios involves several steps of text analytics-related data preparation, followed by the training of the various classifier algorithms under consideration and their scoring and model selection.
Data preparation
The data preparation steps applied to both data sets consist of the tokenization, the removal of stop words and their stemming with respect to the bilingual symptom descriptions. The data records are vectorized using the „Term frequency-Inverse document frequency (Tf-Idf)“, a standard method for measuring the relative importance of a term within a textual structure (Roy, Muni, Yan, Budhiraja and Ceiler, 2016).
Modeling
The classification algorithms trained during the subsequent use case 1 and 2 modelling phases consist of linear (LinSVM) and radial basis function SVM (RbfSVM), k-nearest neighbors (k-nn), and Naïve Bayes (NB). NB, in particular, has been used for text classification in general and SMS spam detection, a field of study similar to the classification problem of Data2Class, specifically (Delany, 2012). We do not consider neural networks due to their relatively poor performance for this type of well-structured problem, as reported by Di Lucca, Di Penta and Gradara (2002).
Model scoring and selection
Our model scoring and selection is based on the standard evaluation metrics Accuracy, Precision, and F1 score, which are defined as follows:
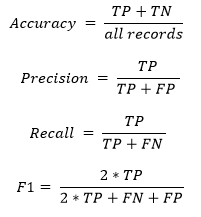
where:
TP represents the number of true positive classifications. That is, the records with the actual label A that have been correctly classified, or „predicted”, as label A.
TN is the number of true negative classifications. That is, the records with an actual label not equal to A that have been correctly classified as not belonging to label A.
FP is the number of false positive classifications, i.e., records with an actual label other than A that have been incorrectly classified as belonging to category A.
FN is the number of false negatives, i.e., records with a label equal to A that have been incorrectly classified as not belonging to category A.
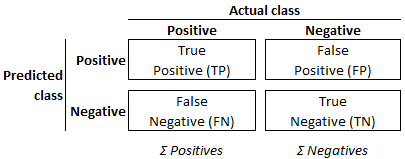
The combination of predicted and actual classifications is known as „confusion matrix”, illustrated in Figure 3. Against the background of these definitions, the various evaluation metrics provide the following insights:
Accuracy: The proportion of the total number of model predictions that were correct.
Precision (also called positive predictive value): The proportion of correct predictions relative to all predictions for that specific class.
Recall (also called true positive rate, TPR, hit rate or sensitivity): The proportion of true positives relative to all the actual positives.
False positive rate (also called false alarm rate): The proportion of false positives relative to all the actual negatives (FPR).
F1: (The more robust) Harmonic mean of Precision and Recall.
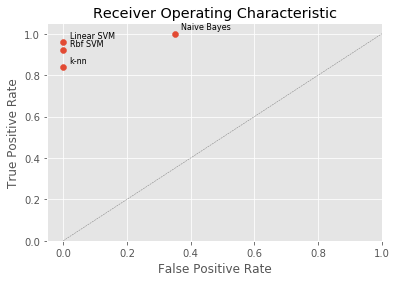
In addition to these evaluation metrics, we consider the “Receiver Operating Characteristic” (ROC) graph of the use case 1 models. ROC graphs are two-dimensional representations of classifier results generated by plotting a binary classifier’s Recall, i.e. true positive rate (y axis), against its false positive rate (x axis), as illustrated in Figure 4. ROC graphs provide an intuitive visualization of a classifier’s relative trade-offs between benefits (true positives) and costs (false positives) and, unlike the evaluation metrics, are insensitive to skewed data distributions.
A ROC graph’s (0, 1) point represents perfect classifier predictions, whilst point (0, 0) corresponds to a classifier never making any positive classification at all and point (1, 1) is equivalent to a classifier unconditionally making positive predictions only. The straight line between these points, i.e. the line TPR = FPR, results from the strategy of randomly predicting a category. Since any classifier can be expected to perform better than this random prediction strategy, the (FPR, TPR)-pairs produced by a classifier should be located above the random strategy line. More specifically, the closer the classifier points are located to point (0, 1) the better.
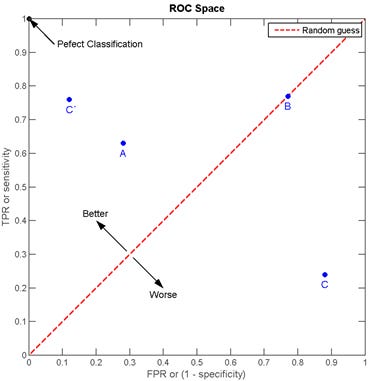
The performance of discrete classifiers such as k-nn, linear and radial basis function SVM, which produce single class labels as predictions, can be illustrated as single (FPR, TPR)-pairs in ROC space. The performance of classifiers such as Naïve Bayes, which generate numeric values indicating class membership “probabilities” relative to a given class membership threshold, can further be illustrated by ROC curves: By varying the threshold value from 0.0 to 1.0, the ROC (graph) pairs produced by these “ranking”, or “scoring”, classifiers result in a curve in ROC space, as shown in Figure 5. This, in turn, allows for the analysis of the area under this curve (AUC) to generate a scalar metric for comparative classifier evaluation.
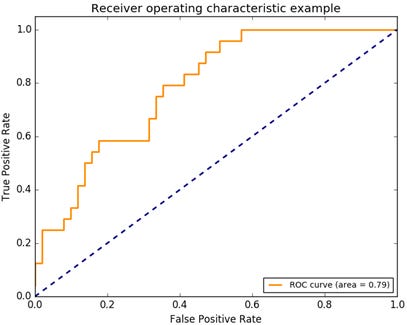
ROC curve generation for discrete classifiers requires their result conversion into numeric values. See, for example, Fawcett (2006) for reference. We limit our discussion to the comparative evaluation of the ROC graph for our four classifiers.
Following multiple data preparation, feature selection and model training iterations, the best scores and confusion matrices obtained for the model training for use case 1 are shown in Figure 6 (example) and Table 4, respectively.
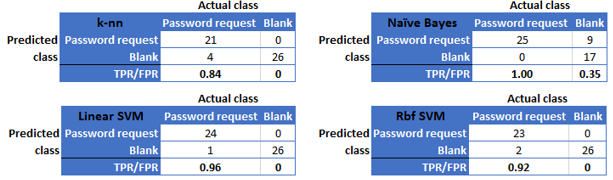
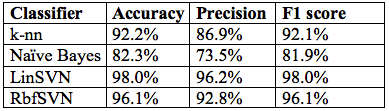
On the basis of the evaluation scores in Table 4 and the comparative ROC evaluation in Figure 7, the linear SVM classifier suggests the best cost-benefit ratio and is therefore the use case 1 model of choice. This is in line with other work in the areas of general text classification and SMS spam detection (Almeida, 2011) (Delany, 2012) (Joachims, 1998). The relatively high model score of well above 95% competes favourably with typical ticket categorization error rates produced by human operators.
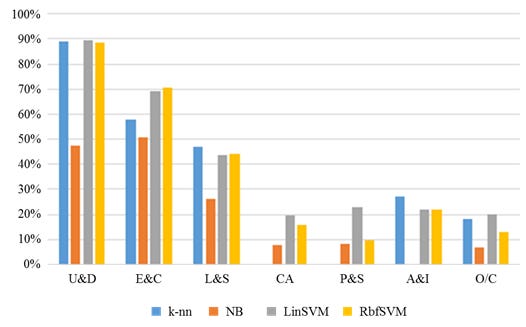
The modeling results for the more general and demanding use case 2 on the basis of Data7Class are shown in Table 5.
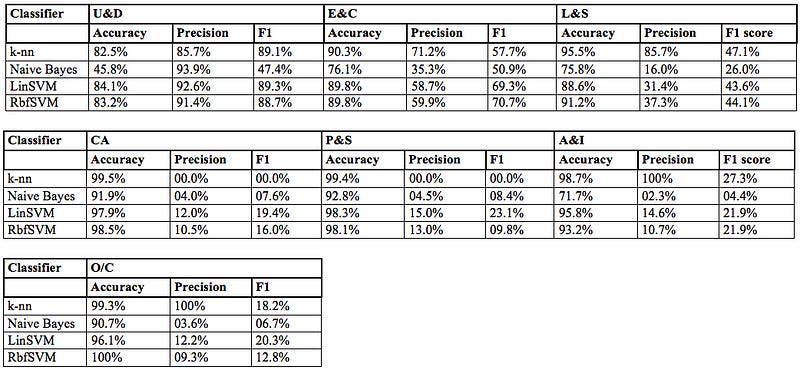
Unsurprisingly, the model scores for this more elaborate use case are less easily interpreted: The model accuracy is consistently high throughout. This is not due to the extraordinarily good model performance but rather to the way accuracy is defined: With the training data distribution heavily skewed, there are only relatively few Data7Class records available for the labels CA, P&S, A&I and O/C, respectively. As a consequence, always predicting that these underrepresented classes will not occur results in a high level of accuracy even though the predictive power of the classifier for new data is highly unlikely to be robust and the classifier should not be deployed under these circumstances.
When additionally having a closer look at the precision values, we get an indication of how many of the records were correctly classified as that label and how many were incorrectly classified as another label: The k-nn (the training of k-nn models for various values of k has led to k = 5 neighbours producing the best results for both use case scenarios) and linear SVM classifiers perform best according to this metric. Note though that the k-nn results for labels A&I and O/C are considerably better than the results produced by the other classifiers for these two classes. At the same time, k-nn produces a 0% score for the CA and P&S labels. This indicates that the k-nn model has been overfitted to the (skewed) training data and is highly likely to produce rather poor categorizations for new ticket data. Against this background, the values for the more balanced and robust F1 score, also illustrated in Figure 8, reveal the overall superiority of the linear SVM model for use case 2.
Linear SVM therefore again represents our model of choice. The results for Data7Class are less impressive overall than those for use case 1, but comparable to other recent results regarding the similar problem of classifying the titles of scientific papers presented in Galke, Mai, Schelten, Brunsch and Scherp (2017). The linear SVM classifier performs well throughout for the most frequently occurring ticket categories U&D, E&C and L&S, overall explaining around 80% of all the labels. In light of the typical real-life data shortcomings, which human operators have to deal with just as much, this represents a competitive result.
In summary, the linear SVM-based models suggest themselves for production deployment for both use case scenarios. In a first step, this could be in the form of automatically suggesting the top three most likely categories to an helpdesk employee working on the ticket categorization step thereby reducing the misclassification risk considerably and speeding up the overall ticket dispatching process.
The biggest challenges you will need to overcome in this context concern the data acquisition and preparation stages. Ticket data are, by their very nature, highly structured with one notable exception: Symptom descriptions. Their text analytics as part of the data preparation phase is arguably the most challenging processing step. To allow for useful model features to result from this step, we recommend to:
retrieve as much ticket-related email communication and transcripts from the ITSM source system as reasonably possible to enrich your symptom description training data;
not to restrict yourself to one- or bi-grams but also to consider word tri-grams during feature generation. Note that we generated our results on as little as 40-character long symptom descriptions, so the method is somewhat “robust”, but can only benefit from additional input data.
When collecting these data from an ITSM production system, you are also likely to be faced with skewed, unequally distributed training data for your particular ticket categorization setup. Certain ticket categories such as user management simply occur so much more frequently than others such as customer applications or administration. To overcome this issue, you may want to:
get ITSM users to create more data manually. This is often cumbersome and recent advances in robotic process or test data automation may help to automate this procedure to a degree;
implement feedback loops from the ITSM production system to the ML training platform for the continuous improvement of the model during its initiation phase using new ticket data when they become available.
Finally, to avoid the issue of overfitting with time when continuously re-training your production model, life-cycle management of your model deployment needs to be considered. This could be in the form of adding a significance score to the training data that decreases with increasing data age. Alternatively, old data could be continuously removed from consideration in favour of up-to-date data fed back into the model training platform.
Our discussion shows one thing quite clearly: ML-enabled ITSM automation is a rather strong proposition. Although we used an analytics platform for the model implementations, our preferred linear SVM algorithm is simple enough to be prototyped reasonably straightforwardly on platforms such as Amazon ML, Google Cloud ML, Microsoft Azure ML, or within your on-premise ML environment using libraries such as sci-kit learn.
Possible model deployment scenarios include the integration of the ITSM production system with a RESTful web service of the trained model on any of the aforementioned platforms. Alternatively and depending on the capabilities of the ITSM system under consideration, the trained model could be implemented statically within the ITSM system directly.
The deployment of such a model can represent the first step on the way towards a fully automated, future-proof end-to-end ticket processing pipeline, especially when considering integrating these solutions with chatbot front-ends for automatic ticket data collection at the start of the process and with ML-enabled automatic ticket solution capabilities towards its end. This way, both a truly scalable 24/7 ITSM solution capable of dealing with the ticket volumes looming in the near future can be obtained and IT resources are freed up for more valuable and rewarding activities such as issue resolution and request fulfillment.
When preferring packaged solutions for this purpose, check out our pointers to leading vendors within this still fairly young product domain, so as to help you select the best product for your particular scenario.
References
Almeida, T. A. [2011]. “Contributions to the study of SMS spam filtering: new collection and results”, Proc. of the 11th ACM Symposium on Document Engineering, Mountain View, CA, USA, pp. 259–262
Delany, S. J. [2012]. „SMS spam filtering: Methods and data”, Expert Systems with Applications, Vol. 39, No. 10, pp. 9899–9908
Di Lucca, G. A. D., M. D. Di Penta, and S. Gradara [2002]. „An approach to classify software maintenance requests“, Proc. of IEEE ICSM, pp. 93–102
Diao, Y., H. Jamjoom, and D. Loewenstern [2009]. „Rule-based Problem Classification in IT Service Management“, Proc. IEEE Cloud, pp. 221–228
Diao, Y., E. Jan, Y. Li, D. Rosu, and A. Sailer [2016]. „Service analytics for IT service management“, IBM Journal of Research and Development, Vol. 60, No. 2–3, pp. 13:1–13:17
Fawcett, T. [2006]. “An introduction to ROC analysis”, Pattern Recognition Letters, Vol. 27, Issue 8, pp. 861–874
Fletcher, C., and Lord, K. [2016]. “Apply Machine Learning and Big Data at the IT Service Desk to Support the Digital Workplace”, Gartner Inc., Stamford, CT, USA
Galke, L., F. Mai, A. Schelten, D. Brunsch, and A. Scherp [2017]. „Comparing Titles vs. Full-text for Multi-Label Classification of Scientific Papers and News Articles”, eprint arXiv:1705.05311, submitted May 2017
Joachims, T. [1998]. „Text Categorization with Support Vector Machines: Learning with Many Relevant Features”, Proc. of the 10th European Conf. on Machine Learning, Springer-Verlag, London, UK, pp. 137–142
Lin, D., R. Raghu, V. Ramamurthy, J. Yu, R. Radhakrishnan, and J. Fernandez [2014]. „Unveiling clusters of events for alert and incident management in large-scale enterprise IT“, Proc. 20th ACM Int. Conf. on Knowledge Discovery and Data Mining, New York, USA, pp. 1630–1639
Roy, S., D. P. Muni, J.-J. Y. T. Yan, N. Budhiraja, and F. Ceiler [2016]. „Clustering and Labeling IT Maintenance Tickets“, in: Q. Sheng, E. Stroulia, S. Tata, and S. Bhiri (eds.), “Service-Oriented Computing. ICSOC 2016”, Lecture Notes in Computer Science, Vol. 9936, Springer, pp. 829–845